
37. Stock Time Series Data Processing#
37.1. Introduction#
This challenge will use stock time series data to build a model through data processing and feature engineering to predict the rise and fall of stocks.
37.2. Key Points#
Time format conversion
Resampling of time series data
Data sorting
37.3. Challenge Introduction#
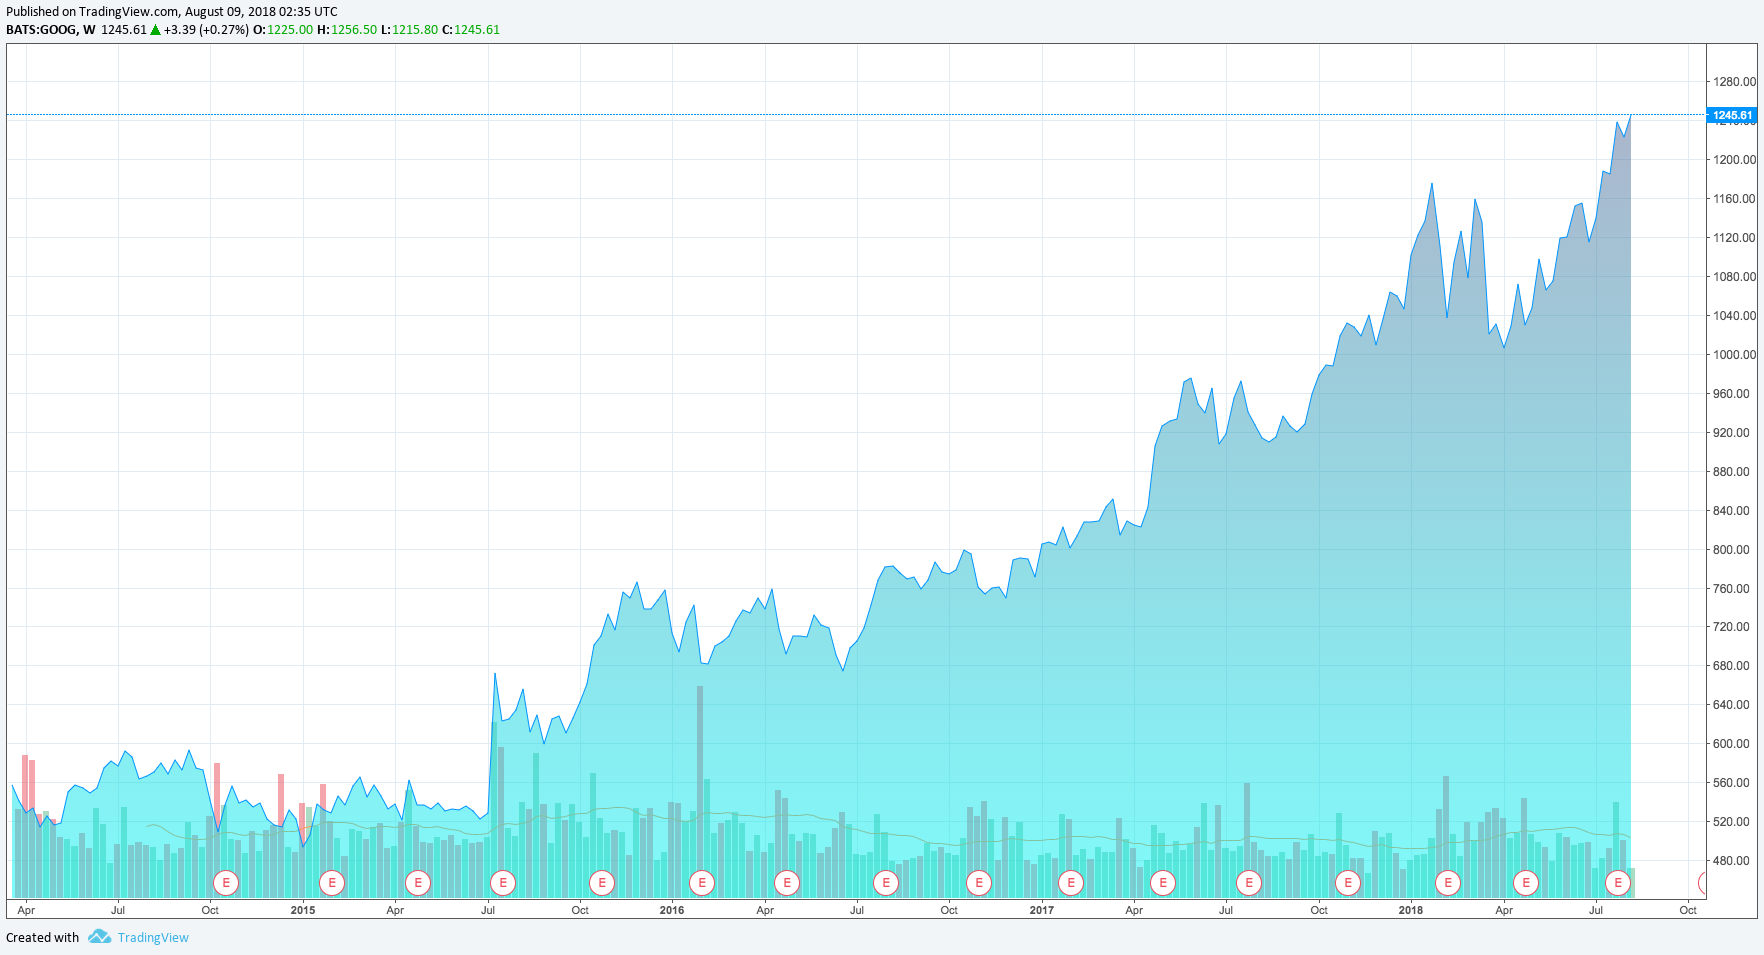
In the time series processing experiment, we initially used the Google stock price change curve graph as an example for everyone. In this challenge, you need to apply the learned time series data processing methods to process the Google stock price change data.
37.4. Challenge Content#
The challenge provides the stock trading data of Google from 2005 to 2018, which is aggregated into the data file GOOGL.csv. Download link:
wget -nc https://cdn.aibydoing.com/aibydoing/files/GOOGL.csv
A preview of the first 5 rows of the dataset is as follows:
Since there are trading days for stocks, the actual start and end dates of the data may not be from January 1st to December 31st.
| Date | Open | High | Low | Close | Adj Close | Volume | |
|---|---|---|---|---|---|---|---|
| 0 | 2005/1/3 | 98.798798 | 101.921921 | 97.827827 | 101.456459 | 101.456459 | 31656700 |
| 1 | 2005/1/4 | 100.800804 | 101.566566 | 96.836838 | 97.347351 | 97.347351 | 27484200 |
| 2 | 2005/1/5 | 96.821823 | 98.548546 | 96.211212 | 96.851852 | 96.851852 | 16456700 |
| 3 | 2005/1/6 | 97.637634 | 98.048050 | 93.953957 | 94.369370 | 94.369370 | 20753400 |
| 4 | 2005/1/7 | 95.415413 | 97.222221 | 94.484482 | 97.022018 | 97.022018 | 19306400 |
The data has 6 columns, namely: transaction date (Date), opening price (Open), highest price (High), lowest price (Low), closing price (Close), adjusted closing price (Adj Close), and trading volume (Volume).
{exercise-start}
:label: chapter04_04_1
The challenge requires performing time series analysis on this data file and sampling the data quarterly. Among them, the mean value is taken for all price-related data, and the total trading volume is taken. Finally, the DataFrame is sorted in descending order by trading volume and returned.
{exercise-end}
37.5. Challenge Requirements#
-
The code needs to be saved in the
Codefolder and namedgoogle_stock.py. -
The code in the following
def
                          quarter_volume()
needs to be completed. At the end of the challenge, the required DataFrame needs to be returned. -
A year can be divided into four quarters, each quarter lasting for 3 months. The first quarter: January - March; the second quarter: April - June; the third quarter: July - September; the fourth quarter: October - December. You need to learn how to perform quarterly sampling by reading the official documentation on your own.
-
When testing, run
google_stock.pyusingpythonto avoid the situation of missing corresponding modules.
37.6. Sample Code#
def quarter_volume():

    ### 补充代码 ###

    return df # 返回题目要求的 DataFrame
{solution-start} chapter04_04_1
:class: dropdown
import pandas as pd


def quarter_volume():
    df = pd.read_csv("GOOGL.csv", index_col=0)
    df.index = pd.to_datetime(df.index)
    df = df.resample('Q').agg({"Open": 'mean', "High": 'mean', "Low": 'mean',
                               "Close": 'mean', "Adj Close": 'mean', "Volume": 'sum'})
    df = df.sort_values(by='Volume', ascending=False)
    return df
{solution-end}